

Stormy outlook for Minnesota in climate change report
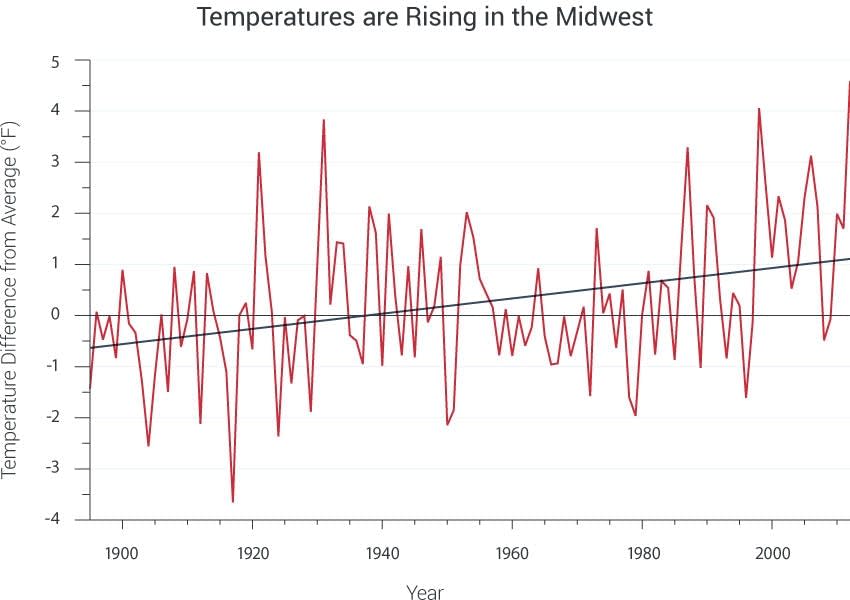
This chart, part of the National Climate Assessment, shows annual average temperatures (red line) across the Midwest show a trend towards increasing temperature. The trend (heavy black line) calculated over the period 1895-2012 is equal to an increase of 1.5 degrees.
Courtesy National Climate Assessment/White House
Go Deeper.
Create an account or log in to save stories.
Like this?
Thanks for liking this story! We have added it to a list of your favorite stories.
