Minnesota's Graduation Gap: Sources

Students on the move
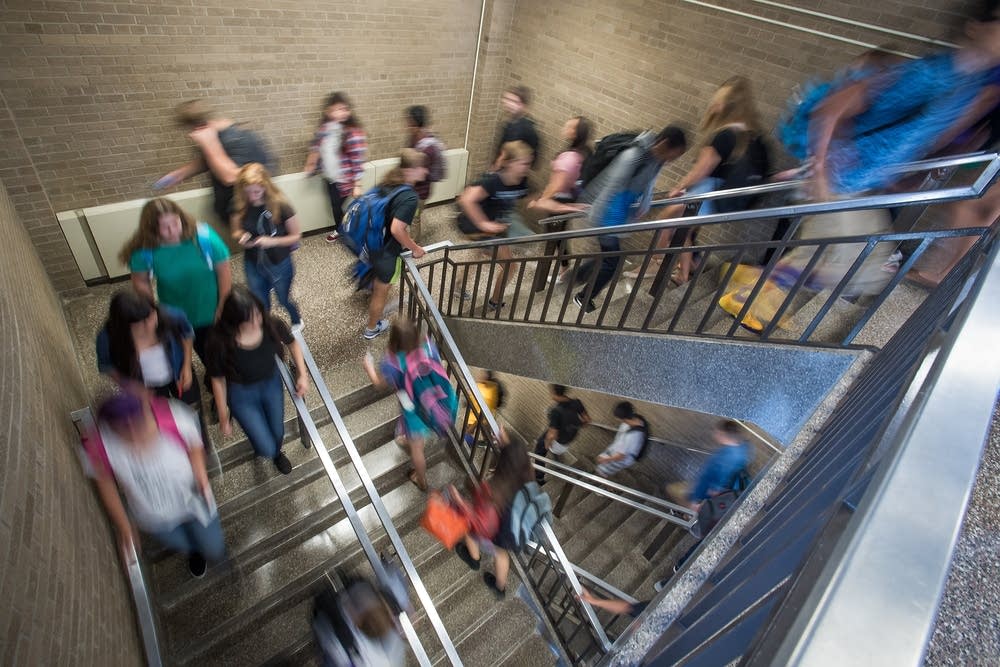
Students head up and down the stairwell on the first day of 2015-16 classes at Bloomington Kennedy High School.
Caroline Yang for MPR News

Full coverage: How did we get here? What's at stake? And what will it take to find a solution?

Create a More Connected Minnesota

MPR News is your trusted resource for the news you need. With your support, MPR News brings accessible, courageous journalism and authentic conversation to everyone - free of paywalls and barriers. Your gift makes a difference.

Minnesota has a tradition of excellence in education, but its high school graduation rates are nothing to brag about — and for students of color, they're among the worst in the nation.

How did we get here? What's at stake? And what will it take to find a solution?

MPR News spent nearly a year exploring those questions through data, academic research, and in the classroom. Dive into some of the sources used in this reporting.

1) No other state spends less of its education dollar on non-classroom student support.

This figure was calculated using the U.S. Census Bureau's annual survey of school finances. The portion of education spending going to student support was determined by dividing a state's total education spending as reported on Table 6 by the amount of student support services spending reported on Table 7. School finance reports are available for 1992-2013.

2) The fastest-growing segment of the future workforce is students of color.

According to the Minnesota State Demographic Center, between 2010 and 2014 the state added four times as many people of color as non-Hispanic white residents, and it says younger Minnesotans are more diverse than older Minnesotans.

Statewide, 31 percent of children under age 5 are children of color — either American Indian, Asian, Black, multiracial, and/or Hispanic.

Minnesota demographics, 1960-2030
As Minnesota's population grows, so does its diversity. By 2030, demographers project, almost a quarter of the state's population will be nonwhite.
MPR News graphic | Source: Minnesota Demographic Center

3) And the fastest-growing segment of the future workforce is students of color — the students least likely to earn diplomas.

Data from the Minnesota Department of Education, compiled by Minnesota Compass, show graduation rates for all students of color have trailed graduation rates for white students since at least 2003.

Minnesota's graduation rates, by race
Minnesota's on-time graduation rates, by race, for the 2014-15 school year
MPR News graphic | Source: Minn. Dept. of Education

4) Schools here spend 2.6 percent of their education dollars on pupil support, a smaller portion than every other state.

The 2013 U.S. Census school finances survey shows Minnesota spent $241,399,000 on student support services out of total spending $9,329,694,000. Dividing the latter figure by the former yields a 2.6 percent rate.

5) It has been that way for a decade, according to an MPR News analysis.

Data from U.S. Census school surveys.

Students head to class on the first day of school.
Students head to class on the first day of school at Richfield High School on Sept. 2, 2015.
Caroline Yang for MPR News

6) These services run the gamut from attendance-tracking to counseling and can help serve the social and emotional needs of students to better prepare them to learn in the classroom.

U.S. Census definition of pupil support services: Expenditure for attendance record-keeping, social work, student accounting, counseling, student appraisal, record maintenance, and placement services. This category also includes medical, dental, nursing, psychological, and speech services.

7) If you're Hispanic, black, Asian-American or Native American, your chances of completing high school are worse in Minnesota than in almost any other state.

The National Center for Education Statistics compiles graduation rate information from the states. The most recent figures are from the 2013-14 school year.

How Minnesota ranks among states
How Minnesota ranks among all 50 states.
MPR News Graphic: William Lager | Source: U.S. Dept. of Education

8) The state sees a racial gap on standardized tests for math in the fourth and eighth grades because white students in Minnesota do exceptionally well on the test and the state's students of color fall in the middle of national rankings.

The National Assessment of Educational Progress (often referred to as the nation's report card) shows Minnesota's white 4th graders ranked first among states on the 2015 math test, while white 8th graders ranked 2nd.

Black students ranked 11th among 4th graders and 14th among 8th graders.

Hispanics ranked 20th among 4th graders and 18th among 8th graders.

9) The overall graduation rate for one of Minnesota's largest school districts, Minneapolis, has hovered around 50 percent in recent years, climbing to 64 percent last year.

See Minnesota Department of Education's Minnesota Report Card.

Students on the move
Students moved through the front hallway on the first day of school at Bloomington's Kennedy High School.
Caroline Yang for MPR News

10) Most other major cities have worked hard to lift up their graduation rates to percentages in the upper 60s or higher over the past decade or so.

An October 2015 report by the Center on Reinventing Public Education placed Minneapolis 50th out of 50 major cities ranked by 2012-13 graduation rates. St. Paul ranked 44th.

11) Minnesota has relatively rigorous course requirements.

NPR thoroughly reviewed state graduation requirements as part of a 2015 reporting project. A comprehensive analysis of each state, including level of rigor, is available on npr.org.

12) Minnesota does have higher levels of poverty and more students with limited English skills among its communities of color, but they're not the highest rates in the country.

Both the U.S. Census report on child poverty (2011) and more recent Census data on poverty in the general population (via American FactFinder) show poverty rates above average for most racial groups, but few cases where Minnesota ranks among the very bottom.

13) ...English language learners, special education students or students eligible for free or reduced lunch

At MPR News' request, the Minnesota Department of Education calculated 2015 graduation rates for student racial groups that didn't include English language learners or students eligible for free or reduced lunch. Those rates:
• Native American 70.73 percent
• Asian 93.16 percent
• Hispanic 80.24 percent
• Black 78.49 percent
• White 93.61 percent

14) Patrick Henry High School in north Minneapolis, where 92 percent of the students are nonwhite, has raised its overall graduation rate to 87 percent.

Henry Senior High 2015 graduation rates via the Minnesota Report Card site.

Patrick Henry High School enrollment, 2015-16
Patrick Henry High School enrollment, by race, for the 2015-2016 school year
MPR News graphic | Source: Minnesota Department of Education/Minnesota Report Card

15) The chief warning signs that a student will drop out are known commonly as the ABCs: attendance, behavior and course performance.

A comprehensive look at early warning indicators, citing the work of Robert Balfanz and others, was published in January 2015 by the Institute of Education Sciences in conjunction with the U.S. Dept of Education.

Lockers await a new school year.
Lockers at Richfield High School on the first day of school in September.
Caroline Yang for MPR News

16) Minnesota schools spend a quarter-billion dollars a year on non-classroom pupil support — $301 per pupil in 2013, and only 2.6 percent of total education dollars.

All these figures come from the U.S. Census annual survey of school finances. The total expenditure reported for pupil support services was $241,399,000. The per-pupil figure is listed on Table 8 of the survey. Percentages were calculated by MPR News as described in the first source note above.

17) Support spending as a percentage of all education spending peaked in 2002 in Minnesota.

Percentage of education money spent on support
Percentage of education money spent on support services for the U.S. and Minnesota, 1993 through 2013
MPR News graphic | U.S. Census Bureau

18) In 2006, Pawlenty proposed a plan that would require all districts to spend at least 70 percent of their budgets on classroom instruction.

MPR News reporter Tim Pugmire reported on Gov. Pawlenty's education spending proposal in 2006.

19) Schools were facing other financial pressures in the 2000s.

U.S. Census school finance surveys show that from 2002 to 2013, per-pupil revenue from the state to Minnesota school districts increased 16.4 percent, while expenses for employee wages and benefits went up 34.3 percent over the same period.

Volunteers leave Patrick Henry High School.
Volunteers leave Henry High School after a 100 Black Men Strong rally in November. The event matched working professionals with African-American, male, high school students for mentoring and support.
Caroline Yang for MPR News

20) Student support as a share of total education spending has remained largely flat during Gov. Mark Dayton's administration.

The proportion of education spending going to per-pupil support was 2.5 percent in 2010, the year Mark Dayton was elected governor. It was 2.6 percent in 2013, the most recent year for which figures are available from the U.S. Census. In dollar terms, the amount has gone from $284 per pupil in 2010 to $301 in 2013.

743 students per school counselor
743 students per school counselor. Source: Minnesota Department of Education
MPR News Graphic | William Lager | Source: MN Dept. of Education

21) Schools would need to spend $75 million a year more to get back to 2002 levels of student support.

In 2002, Minnesota spent 3.4 percent of its education dollars on pupil support services, according to an MPR News analysis of U.S. Census school spending surveys.

To go from the 2013 rate of 2.6 percent to 3.4 percent would require another $88.71 per pupil (using 2013 spending as a base). There are 864,185 students in Minnesota schools this year.

Multiplying $88.71 times 864,185 yields $76.7 million.

22) To match the national average rate of 5.5 percent, they would have to add about $260 million, doubling what they spend now.

The U.S. expenditure for pupil support in 2013 was $601 per pupil. Minnesota spent $301 per pupil, for a difference of $300. Multiplying $300 times the 864,185 students in Minnesota schools yields $259 million.

23) The state budget windfall is projected at $900 million.

From the budget forecast issued Feb. 26, 2016 by the Minnesota Department of Management and Budget.

24) Today Minnesota has one of the most severe counselor crunches in the country, particularly in elementary schools.

Current ratio figures compiled by the American School Counselor Association.

School counselor-to-student ratios nationwide, 2014

MPR News graphic | Source: National Center for Education Statistics via American School Counselor Association

25) State education officials say it would cost about $7 million to hire the number of high school counselors needed to bring Minnesota's ratio up to the national average.

According to Minnesota Department of Education.

26) Dayton has appeared sympathetic to the counselor shortage in Minnesota schools.

In his 2014 state of the state speech, Dayton said: "Schools need more guidance counselors, who are specially trained in career guidance, to help junior high and high school students better understand what their opportunities are and how to prepare for them."

John F Kennedy High School in Bloomington
Kennedy High School in Bloomington on the first day of class last fall.
Caroline Yang for MPR News

27) Bloomington's Kennedy High School's graduation rate, which peaked in 2014, has been fueled largely by gains among black and Hispanic students.

Bloomington Kennedy's graduation rate trends from the Minnesota Department of Education

Bloomington Kennedy High School graduation rates
Graduation rates of Bloomington's Kennedy High School, 2011-2015
MPR News graphic | Source: Minnesota Department of Education/Minnesota Report Card

28) Principal Beaton, like the majority of his staff, is white.

According to data from the Minnesota Department of Education, of Kennedy's 88.27 full-time equivalent licensed teacher and administration positions during the 2014-15 school year, 84.96 were filled by white staff.

29) After several years of steady progress, Kennedy's four-year rate fell from about 92 percent to 80 percent in 2015, with an especially precipitous drop among Latino students.

Bloomington Kennedy's graduation rate trends from the Minnesota Department of Education

30) Support for students can be critical, especially in the ninth grade.

For a good overview, see "Ninth Grade: The Most Important Year in High School,"" published in The Atlantic, Nov. 1, 2013.

31) In 2014, Minneapolis Public Schools started the PREP pilot program, based on research by the University of Chicago.

An overview and links to details of the University of Chicago research can be found here

32) The school's total on-time graduation rate has steadily increased over the past several years.

Patrick Henry High School graduation rates
Patrick Henry High School's overall, on-time graduation rates, 2011-2015
MPR News graphic | Source: Minnesota Department of Education/Minnesota Report Card

Minneapolis Henry's graduation rate trends from the Minnesota Department of Education