2 maps tell (almost) everything about Minnesota's voting population

Minnesotans voting, or waiting for their dad, in Minneapolis.
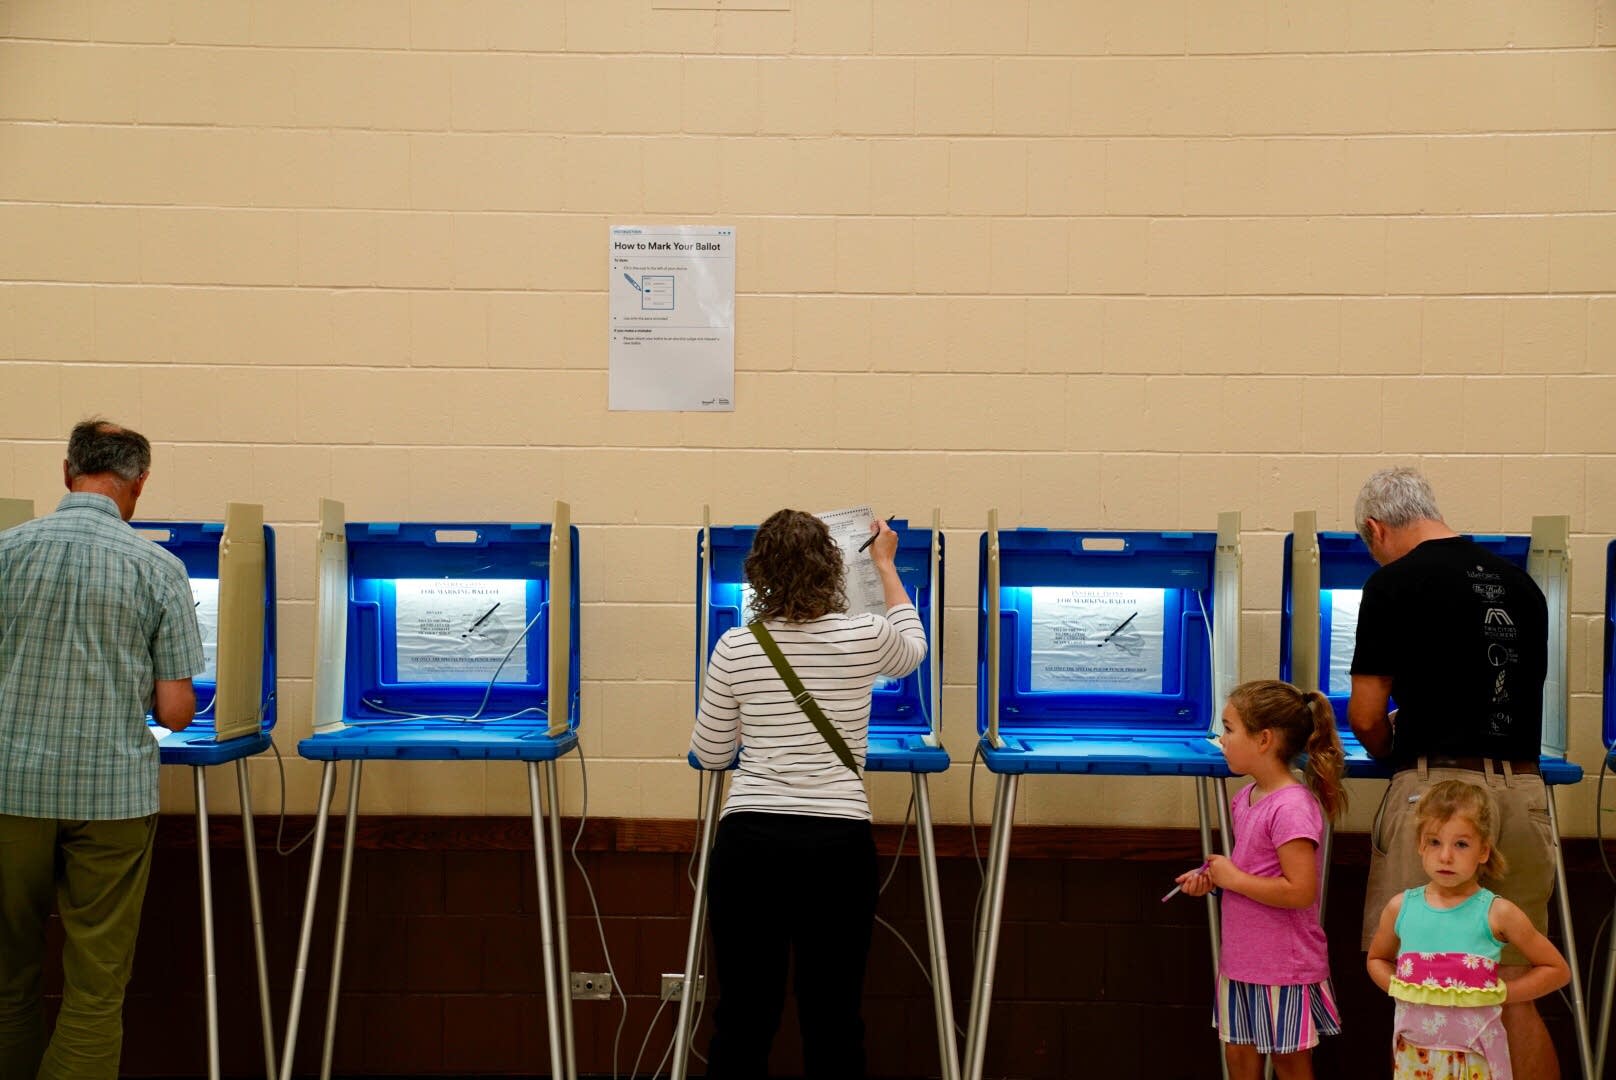
Minnesotans voting, or waiting for their dad to vote, in Minneapolis during the primary election last August.
Angela Jimenez for MPR News

Think you know Minnesota? See if the data agree.

MPR News' sister company APM Research Lab has organized a massive swath of demographic, population and voting data for all of Minnesota ahead of next week's midterm elections.

The Research Lab's new Representing US tools show detailed demographic information for all eight congressional districts, as well as voting insights from 2016.

Which congressional district's the oldest? (The 7th and 8th.) How about the wealthiest? (It's the 3rd District.) Where was the tightest congressional race in 2016? (Northeast Minnesota, the 8th District, where there's another closely watched race this year.)

Create a More Connected Minnesota

MPR News is your trusted resource for the news you need. With your support, MPR News brings accessible, courageous journalism and authentic conversation to everyone - free of paywalls and barriers. Your gift makes a difference.

Andi Egbert, the Research Lab's senior research associate, said the demographics tool's inclusion of potential voters — citizens of voting age; the data do not account for felon status — offers a precise understanding of Minnesota's electorate.

"Those who are actually going to pick the next congresspeople," she said, "assuming they vote."

Most Minnesotans vote if they're legally allowed to do so — the state is consistently a national leader in voter turnout.

However, midterm election years like 2018 have lower turnout rates than presidential election years. For example, almost 75 percent of eligible Minnesotans voted in the 2016 presidential election, according to the Secretary of State. About 50.5 percent voted in the 2014 midterms.

And there is a body of research showing who's more likely to vote (white and/or older people) and who stays away from the polls more often (younger people and people of color).

Still, the Research Lab tools show us what the electorate looks like — everything from age to income to education level to party leaning.

They tell us what the incoming population of eligible voters will be like, too.

"We know that our populations of color are quite a bit younger than our white population in Minnesota, and our youngest residents are most diverse," Egbert said.

Explore the Lab's findings for yourself; you might learn something about Minnesota:

Representing US: Minnesota demographics tool

Representing US: Minnesota voting insights tool


For more from the APM Research Lab, head to its website.