More about the Minnesota voter poll: How it was conducted

BNSF bridge over U.S. 10 in Moorhead, Minn.
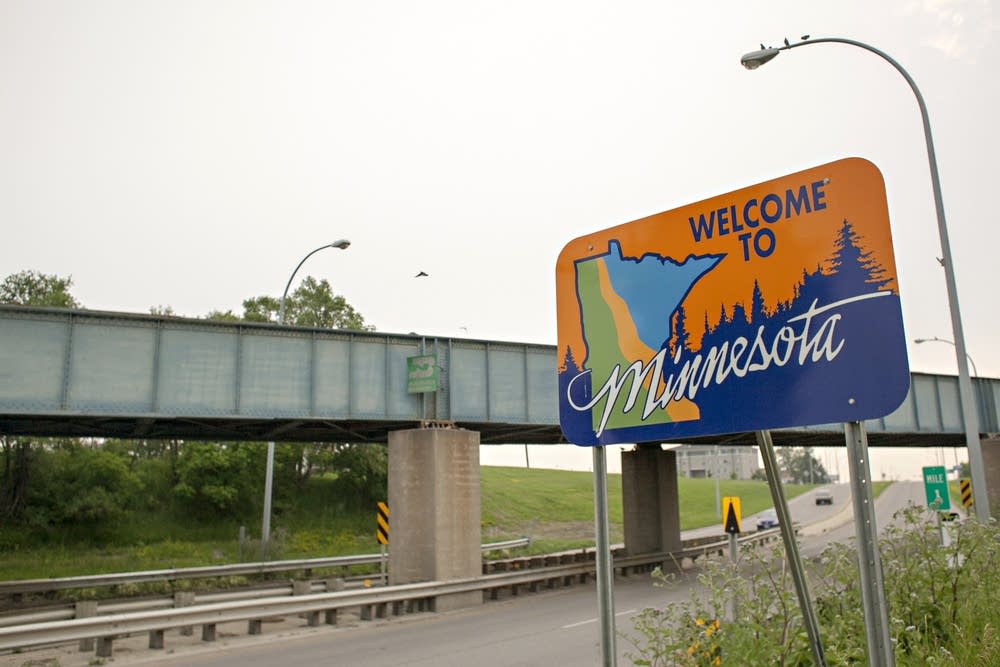
A welcome to Minnesota sign greets motorists as they head east along U.S. 10 in Moorhead, Minn.
Ann Arbor Miller | MPR News

The findings of this MPR News/Star Tribune/KARE 11 Minnesota Poll are based on live interviews conducted Sept. 21 to Sept. 23 with 800 Minnesota voters who indicated they were “likely to vote” in the November general election. The poll was conducted for the Star Tribune, Minnesota Public Radio News and KARE 11 by Mason-Dixon Polling and Strategy Inc.

The sample for this survey was drawn from a Mason-Dixon database that includes approximately 2.2 million registered Minnesota voters who are matched with a telephone number – either a land line, a cell phone or both. A random sample of 100,000 voters from unique households with unique phones was drawn from this database for use in calling on this poll.

Those interviewed were randomly selected by computer from this phone-matched Minnesota voter registration file with quotas assigned to generally reflect the state’s voter turnout distribution by county. For example, Hennepin County and Ramsey County combined accounted for 32.3 percent of the statewide vote in the 2016 presidential election, and accordingly 32.5 percent of the survey interviews were completed there. The interviews were conducted via land line (28 percent) and cellphone (72 percent).

The margin of sampling error for this sample of 800 likely voters, according to standards customarily used by statisticians, is no more than ± 3.5 percentage points. This means that there is a 95 percent probability that the "true" figure would fall within that range if all voters were surveyed. The margin of error is higher for any subgroup, such as a gender or age grouping.

Create a More Connected Minnesota

MPR News is your trusted resource for the news you need. With your support, MPR News brings accessible, courageous journalism and authentic conversation to everyone - free of paywalls and barriers. Your gift makes a difference.

The self-identified party affiliation of the respondents is 38 percent Democrats, 34 percent Republicans and 28 percent independents or other.

Sampling error does not take into account other sources of variation inherent in public opinion surveys, such as nonresponse, question wording or context effects. In addition, news events may have affected opinions during the period the poll was taken.

The demographic profile of this poll of likely voters is an accurate reflection of their respective voter populations. This determination is based on more than 100 statewide polls conducted by Mason-Dixon in Minnesota over the past 32 years — a period that spans eight presidential election cycles that began in 1988.

Have questions leading up to the Election Day? #AskMPRNews. We want to hear your stories, too. #TellMPRNews what is motivating you to get out and vote this year.