COVID trends are mostly flat, but proceed with caution
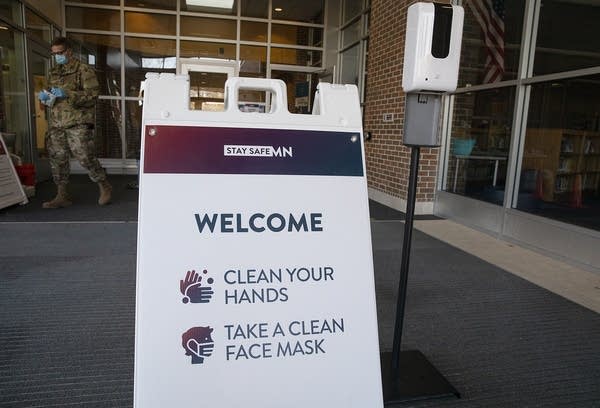
A sign reads "Welcome. Clean your hands. Take a clean face mask."
A sign, photographed on Nov. 23, 2020, encourages people to take safety precautions as they enter the COVID-19 saliva testing site at Ridgeview Elementary School in Bloomington.
Christine T. Nguyen | MPR News 2020

Caution signs are yellow, and so is much of this week’s “Community Level” assessment map from the U.S. Centers for Disease Control and Prevention — at least for Minnesota. In addition, while this week’s data on case rates and wastewater are mostly continuing on a high plateau, COVID-related hospitalizations increased a bit over the past week. COVID-related deaths, meanwhile, are trending down after a peak in July.

With tens of thousands of Minnesotans getting together daily at the State Fair, and millions of students returning to school in the near future, we wish that the data showed vanishing COVID-19 risks. But, as the graphs and maps below continue to show, that is not the case.

3 things to know:

1) Hospital bed use is on the rise, even as deaths are falling.

2) Latest wastewater data shows small weekly increase in Twin Cities and recent decreases in some areas of greater Minnesota where COVID had been increasing.

Create a More Connected Minnesota

MPR News is your trusted resource for the news you need. With your support, MPR News brings accessible, courageous journalism and authentic conversation to everyone - free of paywalls and barriers. Your gift makes a difference.

3) The CDCs weekly “Community Level” COVID-19 risk assessment puts most Minnesotans in a “medium” category.

Plus a dive into the economic impact of long COVID, and how many Minnesotans have been affected by it.

Hospital bed use is on the rise, even as deaths are falling

It feels like we’ve been talking about a COVID plateau for ages now, but this time we really mean it. Weekly cases by region show a remarkable lack of change over the past six weeks, even if there are some ups and downs week-to-week.

Weekly COVID-19 cases in Minnesota regions
Cases across Minnesota have continued to stay constant.
David Montgomery

Hospital admissions, though, have been slowly creeping up in recent weeks.

New COVID hospitalizations in Minnesota
Hospitalizations have been creeping up in recent weeks.
David Montgomery

And looking at COVID-19 hospital bed use shows a clear upward trend among patients with COVID-19 in non-ICU beds. The non-ICU bed usage is just a bit higher than this time last year, when the delta variant was taking off.

Intensive Care Unit bed usage is, however, substantially lower than in 2020 or 2021.

COVID-19 hospital bed use in Minnesota
Non-ICU bed usage for patients with COVID-19 has been on the rise.
David Montgomery

Despite the increase in hospitalizations, fewer people are now dying from COVID each day than was the case in July.

Minnesota COVID-19 deaths by year
Deaths have fallen in recent weeks after a relative peak in July.
David Montgomery

Wastewater: Mostly stagnant

As usual, the most timely wastewater analysis comes from the Metropolitan Council’s on-going collaboration with the University of Minnesota’s Genomic Center. Their analysis of wastewater from the state’s single largest treatment plant, the Metro plant serving nearly 2 million people, shows a 4 percent week-over-week increase in COVID levels for the week ending Aug. 22.

This follows weeks of similarly small declines, leaving us with yet another trend line that looks like a bumpy plateau. As we have noted in the past, this plateau is relatively high, with COVID levels similar to those measured during November in last fall’s wave. We are, however, no longer dealing with the delta variant that was dominant at that time, but rather omicron subvariant BA.5.

COVID load in Twin Cities metro wastewater 8-26-22
COVID-19 levels measured in at the Metro wastewater treatment plant in St. Paul, Minnesota.
David H. Montgomery | MPR News

The latest data out of the University of Minnesota’s Wastewater SARS-CoV2 Surveillance Study, through Aug. 14, shows slight monthly and weekly decreases in a more broadly defined Twin Cities Metro region (sampling 13 wastewater treatment plants collectively serving 2.8 million people).

Thankfully the climbing levels of COVID-19 evident in last week’s data from the North West, North East and South West regions appear to be turning the corner. But the increasing levels still show up in this week’s monthly change column, and we will have to wait and see if the most recent weekly decline holds.

The only region in the study showing both monthly and weekly increases is the South East, which includes samples from treatment plants located in Dakota, Fillmore, Freeborn, Olmsted and Winona counties. Fortunately, those increases are only in the single digits, and the case count data shown above shows southeastern Minnesota cases holding steady.

CDC to most Minnesotans: Proceed with caution

Last week we noted that the CDC had ratcheted up the warning level to medium risk for the entire Twin Cities region on the eve of the State Fair, and now we can confirm that the same level of concern has expanded to additional counties: 51, up from 25 last week.

A few of those are downgrades from high ratings, which are now in effect for 13 counties instead of last week’s 18. For example, Olmsted County, which the CDC has often rated as high risk, has been downgraded from orange to yellow. But more counties turned from green to yellow; 44 were rated low risk last week, but only 23 this week.

The CDC’s “Community Level” map takes into account both COVID-19 case rates and hospitalizations. Looking only at the latest weekly case rates, all but six of Minnesota’s counties meet the CDC’s threshold for high transmission (100+ weekly cases per 100,000 residents). Central Minnesota’s Todd County once again has the state’s highest rate, with over 400 officially reported cases per 100,000 for the week ending Aug. 24. Weekly case rates in Stevens, Chippewa, Watonwan and Wadena counties all exceed 300.

Survey Says: Minnesota’s long COVID rates are below national average

A new study out this week from the Brookings Institute estimates that about 3 million full-time equivalent workers in the U.S. are currently out of the labor market due to long COVID. The report uses an average weekly wage of $1,106 to translate that into $168 billion a year in lost earnings.

Katie Bach, the report author, notes that this estimate doesn’t include the full economic burden of COVID. Other impacts include lower productivity of people working while ill, the significant health care costs patients incur, and the lost productivity of caretakers, she writes.

The Brookings Institute bases part of its study on the results from the Census Bureau’s Household Pulse Survey, which started asking questions about post-COVID conditions in June. That data is available  by state, and defines long COVID as having had COVID with symptoms that lasted three months or longer.

The latest data, from the Pulse Survey conducted in late July/early August, shows that Minnesotans overall have fared better than the national average in terms of percentage of the population that has or is experiencing long COVID symptoms:

  • Around 14.8% of Americans, and 13.2% of Minnesotans, have said they have ever experienced long COVID symptoms. Pennsylvania has the lowest percentage of this metric, at 8.8%, and South Dakota has the highest, at 19.6%.

  • Around 7.6% of Americans, and 6.3% of Minnesotans, have said they are currently experiencing long COVID symptoms. Pennsylvania also has the lowest percentage of this metric, at 4.3%, and Iowa has the highest, at 11.3% (Alabama comes in at a very close second, at 11.2%).

Minnesota seems to be doing particularly well on long COVID compared to neighboring states. See maps below for more.

These survey results provide one indication of the prevalence of long COVID, but estimating how many people have had long COVID is a debated topic in the scientific community, with the estimates ranging from five to 50 percent depending on how it’s defined. Despite this wide range, experts have noted that the take-home point should be that a substantial percentage of the population seems to be affected, and that it’s a real problem.

How can the impact of long COVID be improved? The Brookings report details five policy actions that they think could make a difference: better prevention and treatment options, expanded paid sick leave, improved workplace accommodations, wider access to disability insurance and enhanced data collection on long COVID’s economic effects.

Not getting long COVID in the first place will probably help the most, although estimates of how well vaccines may help prevent long COVID are uncertain. Recent studies suggest that people can reduce their risk of long COVID by anywhere from 15 to 50 percent by getting vaccinated. Not getting COVID at all, of course, is your best bet.