Amid slight rise in MN COVID deaths, CDC says bivalent booster adds protection
Go Deeper.
Create an account or log in to save stories.
Like this?
Thanks for liking this story! We have added it to a list of your favorite stories.
This weekend the Minnesota Department of Health will close the remaining free, state-run COVID-19 testing sites: St. Paul Midway, Minneapolis-St. Paul Airport, Brooklyn Park and Duluth.
Although these sites are closing, Minnesota Commissioner of Health Dr. Brooke Cunningham emphasized in a press release announcing the closures that “COVID-19 tests will continue to be widely available to Minnesotans from a variety of sources.” These sources include ordering free at-home rapid tests through the state, and clinics and pharmacies that provide testing services, which can be located through the state’s Find Testing Locations page.
A decline in demand over the last year, seen in the graph below, is a big contributing factor to the decision to close the four sites.
The additional testing sources mentioned above also play a role in the decision. In an email to the APM Research Lab, Minnesota Department of Health spokesperson Garry Bowman said, “We are also in such a better place than we were a year ago with testing availability for Minnesotans — from at-home tests to pharmacies to primary care providers. The picture looked much different in the fall and early winter months of 2021, not to mention the early days of the pandemic when tests were very challenging to find.”
Bowman also mentioned how these closures fit into the state’s view of where we are in the pandemic: “Essentially the testing site closures are part of the state’s transition away from COVID-19 emergency response work and back to the regular operations of health care and public health.”
Support Local News
When breaking news happens, MPR News provides the context you need. Help us meet the significant demands of these newsgathering efforts.
If you do test positive for COVID-19, a reminder that the state is providing free telehealth services and treatment.
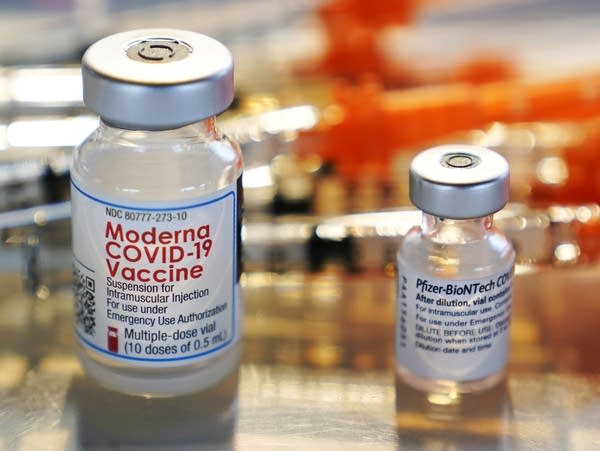
The COVID-19 vaccine is still also free (in-home options, too), and most people who haven’t gotten the bivalent booster dose are eligible to receive it. A Centers for Disease Control and Prevention survey, however, found that many adults were not aware of their eligibility for or the availability of the bivalent vaccine. The next most common reason for not receiving the bivalent dose was the perception of already being protected against infection or severe symptoms.
If you’ve been on the fence about whether to get the bivalent booster, there’s mounting evidence of its effectiveness. Recent data from the CDC has shown that the most recent booster dose:
helps protect against acquiring infection, according to research with nursing home residents,
helps protect against symptomatic infection against subvariants XBB and XBB.1.5, which is on the rise here in Minnesota,
helps reduce the chance of an emergency visit or hospitalization, relative to being unvaccinated as well as relative to having only received monovalent doses, and
helps reduce the chance of death by 13-fold compared to unvaccinated persons, and two-fold compared to people with at least one dose of the monovalent vaccine but no bivalent dose.
COVID hospitalizations continue to fall, but deaths still rising
Speaking of the bivalent booster — most Minnesotans under 65 years old have not received it, indicated in this graphic as the “up-to-date” category. Among those 65 years and older, 61 percent have received the bivalent booster.
After several weeks of mostly declining case reports across the state, results are a little more mixed in this week’s update. Cases in most regions were either slightly up or slightly down, but the southwest portion of the state saw cases rise more dramatically.
Non-intensive care unit hospital admissions for COVID have dropped in recent weeks, just about as sharply as they rose last spring. ICU admissions are down somewhat from where they were in November.
The seven-day average of COVID mortality reached 10 deaths per day for four days in early January. This is the longest stretch at that level or above since early March when the major omicron surge was winding down. Hopefully the decline in hospitalizations will soon be reflected in deaths as well, as has often been the case. But like everything with COVID, there are no guarantees.
Wastewater: Declining COVID levels in the Twin Cities and throughout the state
The most recent wastewater report from the Metropolitan Council and the University of Minnesota’s Genomic Center notes: “The total viral RNA load entering the Metro Plant decreased by 18 percent last week compared to a week earlier. It is now at the same level it was during the last week of December.”
In terms of subvariants, the Metropolitan Council reports that “XBB made up 48 percent of the viral RNA entering Metro last week, a slight increase over the previous week’s level of 46 percent.” They also note that the BA.2 sublineage, of which XBB is a subvariant, and the BA.5 sublineage comprised roughly equal portions of the viral RNA load entering the Metro last week.
According to the Minnesota Department of Health’s data regarding variants in sequenced cases for the surveillance period ending Dec. 31, the proportion of clinical samples identified as XBB has increased to nine percent from six percent in the previous period. According to MDH spokesperson Garry Bowman, “this is the third consecutive two-week period of growth for XBB lineages with evidence suggesting that next week will bring another increase.” He went on to tell the APM Research Lab via email that “national trends, wastewater data, and experience from the Northeast … all suggest that we’re in a transition from BA.5 to XBB sublineages.”
After several weeks of mixed signals, the latest data out of the University of Minnesota’s Wastewater SARS-CoV2 Surveillance Study shows declining COVID levels throughout the state for the week ending Jan. 15. Every region saw declining COVID levels over both the past four weeks and the past week except for the study’s South West region, which experienced a 25 percent increase over the previous four weeks before experiencing a 23 percent decrease over the prior week.
Although the South West region saw a four-week increase in COVID levels, it is a modest increase compared to the increases that region has seen recently. For the week ending Jan. 1, for example, the South West region saw an increase of 124 percent over the prior four weeks. Nonetheless, the recent increase in cases in southwestern Minnesota, along with the CDC’s indicators highlighted further down, suggest this might be a part of the state where it would be wise to take extra precautions right now.
Five of the study’s seven regions saw declines in COVID levels between 20 percent and 30 percent over the prior week. This includes the Twin Cities Metro, which incorporates measurements from 13 plants collectively serving 2.8 million people.
The study’s South Central and Central regions saw the largest four-week declines, 49 percent and 44 percent respectively.
CDC rates three counties as high risk this week, the highest number since early December
According to the new Centers for Disease Control and Prevention’s “Community Level” COVID-19 assessments, the map of Minnesota isn’t quite as green as it was last week, when all but one county was rated low risk. This week, Nobles, Big Stone and Traverse counties are rated high risk and seven other counties are rated medium risk. Although still low, this week’s assessment has the largest number of high-risk counties since early December. The number of medium-risk counties this week is still very low as compared to previous weeks.
Case rates add another layer to the map above and somewhat temper the still large amount of the state painted green. This week, 32 of the state’s counties meet the CDC’s definition of high transmission (weekly case rates of 100 or more cases per 100,000), and three of those counties — Lac qui Parle, Nobles and Mahnomen — have a weekly case rate that exceeds 200 per 100,000. This is a significant increase from last week when only four counties met the high-transmission threshold.
Forty-eight of the state’s counties meet the CDC’s definition of “substantial” transmission (weekly case rates of 50-99.9 per 100,000), which is a slight increase from the 42 counties that fit that definition last week.